Using Google Sheets and the Enplug Webpage App, you can display KPI dashboards or other data on your displays.
Once you have data or charts in a Google spreadsheet, you'll need to use the Webpage App to add the URL of the data or chart you want to add.
To get this URL, you'll need to publish the desired chart or sheet to the web. You can choose to publish the chart (not the associated data) or only one sheet in the file. Click the arrow in the upper right corner of the chart or, if you're publishing an entire sheet, click File, then Publish to the web.
Once you've clicked this option, it'll confirm you want to publish the selected sheet or chart. From here, you'll be provided with a URL. This URL should be entered in the URL section of the Webpage App, as shown below:
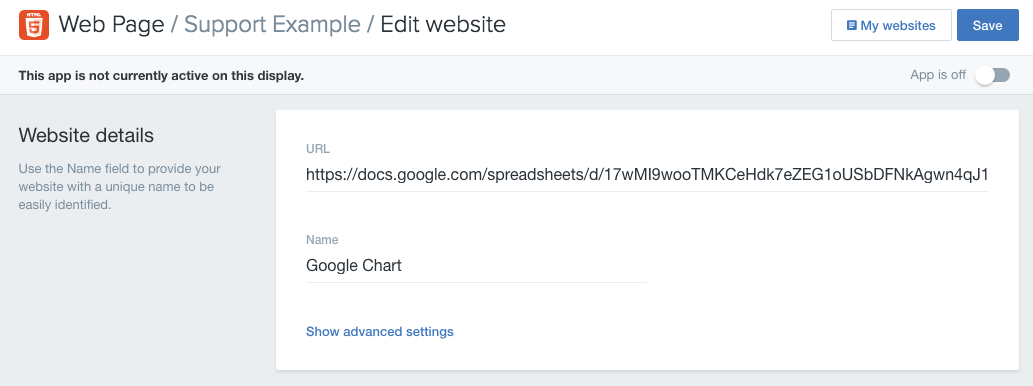
If you need to resize the chart to fit the screen, you can use Show Advanced Settings to view the Text Scale option. This is a percentage; if you set it over 100, it'll zoom further into the chart.
For questions or concerns, please reach out to our Support Team at support@spectrio.com.